What kind of recovery will there be post-COVID? Of course absent a crystal ball, it’s hard to predict. But we can gain some insight on the specific topic of office space demand by understanding the impact of the pandemic on the type of employment that resides in office space. From this understanding, it’s also possible to speculate in an informed way about near-term changes in vacancy rates and rents.
Much of what has been written has focused on the impact of the work from home (“WFH”) phenomenon and it’s intermediate-term impact on office demand. That’s not the focus of this piece, and frankly the intense focus on this issue takes away from a clear assessment of the greatest threat to the office market: the effect of the pandemic on jobs, and in particular on job losses among white-collar workers.
What Kind of Recovery?
Some of those attempting to forecast the recovery have speculated on whether there will be a “U-Shaped,” “V-Shaped,” “K-Shaped” or flat-line recovery.
This was the theme of a recent article by the president of the US Chamber of Commerce: The K-Shaped Recovery and the Cost of Inaction. Citing national statistics, she states: The K-shaped recovery is also evident in employment numbers. The financial services sector, for example, has already recovered 94% of its pre-pandemic employment. Leisure and entertainment, on the other hand, has only brought back 74% of the workforce.<Cite 1>
Many of the articles being written focus on the issue of inequality in society and conclude that the K-shaped recovery exacerbates it.<Cites 2,3,4,5> That’s a subject for economists and politicians to debate. The focus of this post is much narrower. How is the current economy influencing the demand for office space, and is a differential effect of the downturn (and possibly the recovery) likely to make things worse or better for the commercial office market? Suzanne Clark’s article also focused on the United States as a whole. What about New York City specifically?
Intuition suggests that job losses have fallen disproportionately on the retail and service sectors, which would overstate the impact of the pandemic on the New York office market. But how much?
Data and Analysis
We used this methodology to give some focus to this subject: we extracted data from the New York State Department of Labor (“NYSDoL”), specifically its dataset NYC Current Employment Statistics (CES) Latest Month. This series provides around 125 categories of establishment that roll up into a smaller set of summary categories. For the analysis we separated categories broadly into “office-using” and “non-office using.” While this is certainly a simplification (since some “non-office using” classifications use some office space, and some “office-using” establishments have their employees working outside traditional offices) it gives a good first order approximation of the totals. <Cite 6>
The following “non-office using” categories were used:
- Construction of Buildings
- Manufacturing
- Service Providing
- Wholesale Trade
- Retail Trade
- Transportation and Warehousing
- Arts Entertainment and Recreation
- Accommodation and Food Services
These “office using” categories were used:
- Information
- Finance and Insurance
- Real Estate and Rental and Leasing
- Professional Scientific and Technical Services
- Management of Companies and Enterprises
- Administrative and Support Services
The NYSDoL has published data up to August of this year, and although that’s a couple of months behind the current date, it’s far enough into the COVID crisis to give a sense of (at least) what the employment impact has been.
Here is a pivot-table of the data:
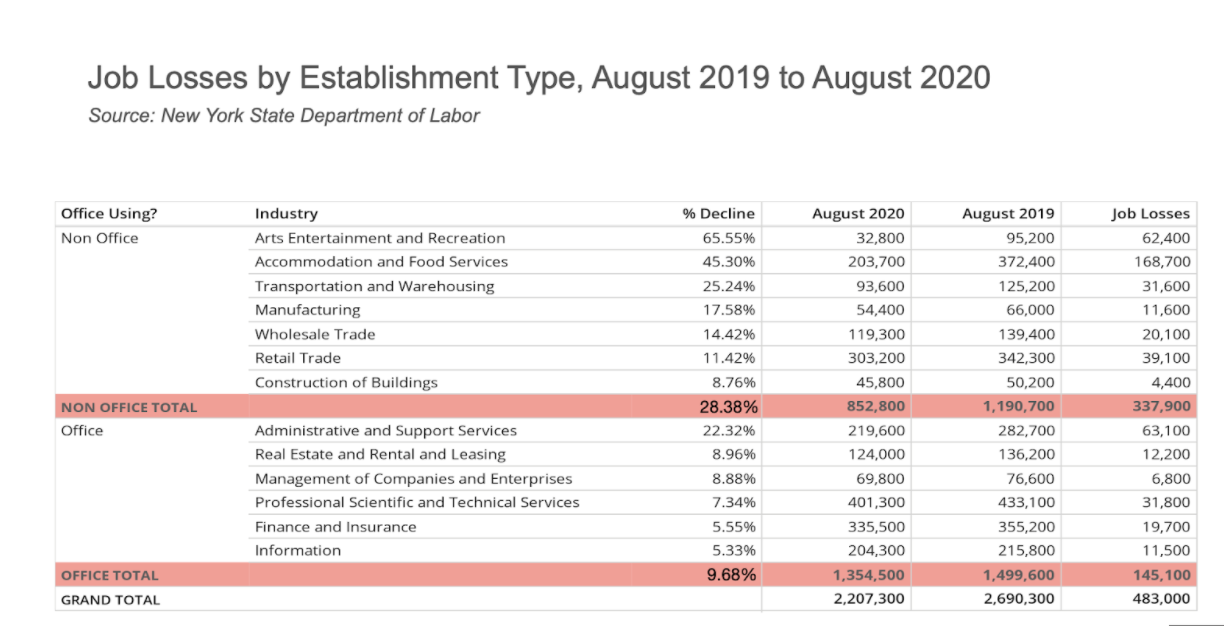
The headline on this data is that the decline in employment in the non-office-using segment is (on average) triple that of the office-using segment (28.38% versus 9.68%). This snapshot seems to support the K-Shaped narrative, with Arts and Entertainment and Food Services at one end of the spectrum, and Finance and Insurance at the other.
Another way of looking at the data is to produce a bubble chart. The Y-axis represents jobs in 2019 and the X-axis jobs in 2020. Distance below the X=Y line indicates jobs lost. The bubbles are scaled by the percentage of jobs lost.
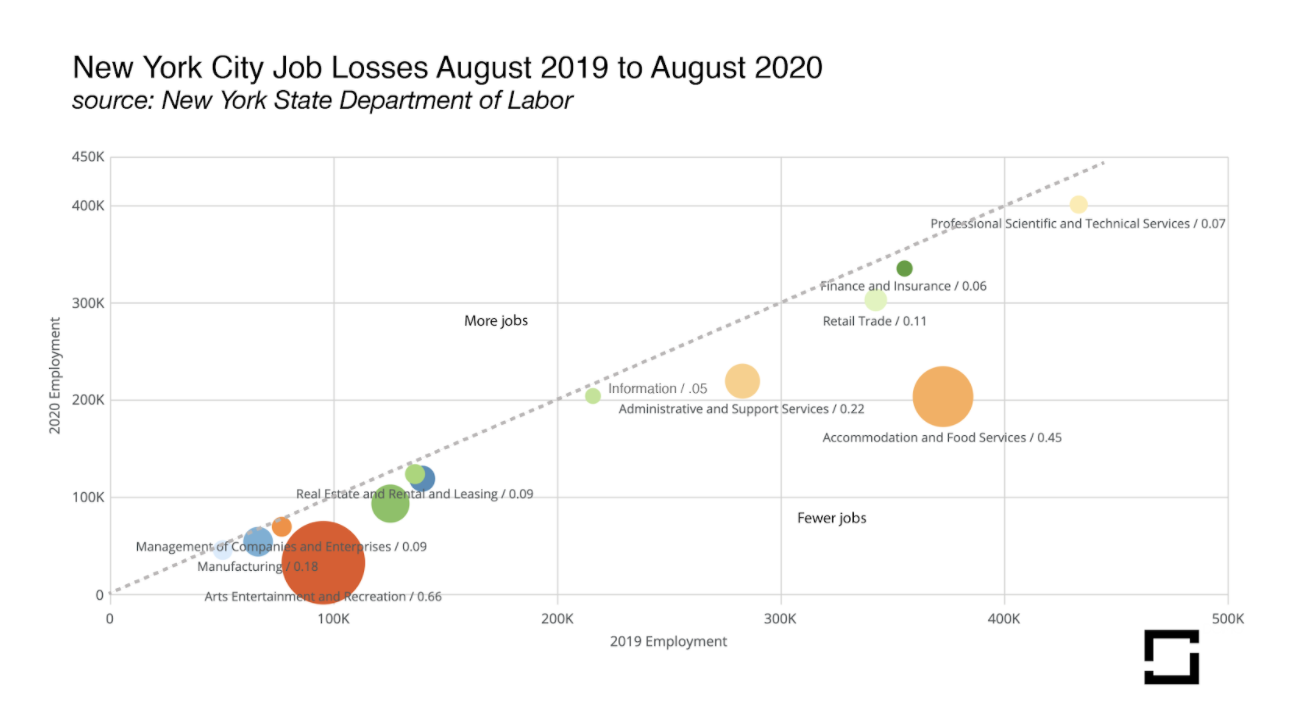
Sadly here are no establishment groups above the line.
A second question to ask is: will a 9.7% reduction in office-using employment translate directly into a corresponding reduction in office-space demand?
A review of the categories suggests that office-using categories that use more square footage per employee are less hard hit than those that use less. To get a rough magnitude of this effect, the following table of (relative) rentable square footage utilization was employed:
| Management of Companies and Enterprises | 300 |
| Finance and Insurance | 250 |
| Information | 200 |
| Real Estate and Rental and Leasing | 200 |
| Professional Scientific and Technical Services | 200 |
| Administrative and Support Services | 100 |
Using this to construct a weighted average, and then calculating the percentage decline of this average shows that the effect on office demand could be less than the effect on office-using employment: a reduction roughly from the 9.7% shown above, to something on the order of 8.2%.
While this is still a very substantial reduction in demand, if this is the nadir (or close to the nadir) then a recovery–particularly one that occurs faster among more highly compensated and more office-intensive employees, or the upper leg of the “K”–might bring about a new (lower) rent equilibrium in a period shorter than some industry experts have been predicting. The phrase “stay alive ’til 2025” is already in the blogosphere. <Cite 7> But perhaps it might be “this will be done by end ‘21.” Let’s hope that’s the case in any event.
Studying prior real estate cycles and the extensive literature on the relationship between vacancy rates and rent. This link provides a short but useful bibliography: <Cite 8>. It is clear that the marginal impact of a reduction in demand of this magnitude might still have a significant impact on prices (rents). There have been many articles written specifically about the concept of a “frictional vacancy rate” which, when exceeded, causes a (very) non-linear reduction in prices. A change in demand of only two or three percent might take the market from equilibrium (which it presumably was in prior to COVID) into a sufficient level of oversupply to affect prices well out of proportion to the percentage change in demand. In prior cycles a move from say 8% vacancy to 12% has triggered price reductions three or more times the percentage change (say 15%).
Conclusions
The downturn is a tragedy for New York businesses and their employees. Whether the damage is repaired swiftly or slowly remains to be seen, although if history is a guide the damage will be repaired. On the particular micro-topic of the effect of this recession on office demand, a couple of key points stand out:
- The recession has hit higher-wage employees who generally work in offices less hard than those who do not, and this can be quantified pretty well: the impact has been roughly three times greater.
- This analysis supports the K-Shaped recovery thesis, at least insofar as the bifurcation of the downturn; whether the recovery proceeds in the same fashion as the decline remains to be seen, but it seems intuitive that it would.
- The impact has been lower among the heavy users of office space, meaning that the demand impact should be lower as well.
- Despite the last point, the change in demand is likely to push the market from equilibrium (if that was the state pre-COVID) to an oversupply situation, perhaps enough to require a significant reduction in rents.
- 2020 has not had much good news for tenants or landlords, except insofar as those tenants relatively unscathed by the economic downdraft might see opportunities for generational transactions as the (inevitable) supply/demand/price adjustment takes effect over the next months.
Bibliography
Cite:: 2
Author(s):: Jeff Cox
Full Title:: Worries Grow Over a K-Shaped Economic Recovery That Favors the Wealthy
Publisher:: cnbc.com
Date:: September 4th, 2020
URL:: https://www.cnbc.com/2020/09/04/worries-grow-over-a-k-shaped-economic-recovery-that-favors-the-wealthy.html
Cite:: 5
Author(s):: Andrew Bary
Full Title:: New York City’s Offices Are Empty. How to Gamble on a Recovery.
Publisher:: Barrons
Date:: August 31st, 2020
URL:: https://www.barrons.com/articles/new-york-citys-offices-are-empty-how-to-gamble-on-a-recovery-51598649120
Cite:: 4
Author(s):: [[Allana Akhtar]]
Full Title:: Meet the ‘K-Shaped’ Recession, Where Professional Workers Are Largely Fine and Everyone Else Is Doing Awful
Publisher:: Business Insider
Date:: September 30th, 2020
URL:: https://www.businessinsider.com/what-is-a-k-shaped-recovery-coronavirus-pandemic
Cite:: 3
Author(s):: Talib Visram
Full Title:: Forget U or v or W: We May Be Headed Toward a K-Shaped Recovery
Publisher:: Fast Company
Date:: September 11th, 2020
URL:: https://www.fastcompany.com/90549147/forget-u-or-v-or-w-we-may-be-headed-toward-a-k-shaped-recovery
Cite:: 1
Author(s):: Suzanne Clark
Full Title:: What is the K-Shaped Recovery?
Publisher:: US Chamber of Commerce uschamber.com
Date:: September 3rd, 2020
URL:: https://www.uschamber.com/series/above-the-fold/the-k-shaped-recovery-and-the-cost-of-inaction
Cite:: 6
Author(s)::
Full Title:: Labor Statistics for the New York City Region
Publisher:: [New York State Department of Labor
Date:: October 2020
URL:: https://www.labor.ny.gov/stats/nyc/
Cite:: 7
Author(s):: Joe O’Donnell
Full Title:: Real Estate Outlook (Stay alive to 2025!) – Video
Publisher:: Omega Commercial Real Estate
URL:: https://twitter.com/OmegaRE/status/1309530645014761474?s=20
Cite:: 8
Brief but useful bibliography on Rent and Vacancy
- Brounen, D. & Jennen, M. (2009) Asymmetric Properties of Office Rent Adjustment. The Journal of Real Estate Finance and Economics, 39, 336.
- Chau, K.W. & Wong, S.K. (2016) Information Asymmetry and the Rent and Vacancy Rate Dynamics in the Office Market. The Journal of Real Estate Finance and Economics, 53, 162-183.
- Grenadier, S.R. (1995) Local and National Determinants of Office Vacancies. Journal of Urban Economics, 37, 57-71.
- Rosen, K.T. (1984) Toward a Model of the Office Building Sector. Real Estate Economics, 12, 261-269.
- Voith, R. & Crone, T. (1988) National Vacancy Rates and the Persistence of Shocks in U.S. Office Markets. Real Estate Economics, 16, 437-458.
- Wheaton, W.C. (1999) Real Estate “Cycles”: Some Fundamentals. Real Estate Economics, 27, 209-230.
- Wheaton, W.C., Torto, R.G. & Evans, P. (1997) The Cyclic Behavior of the Greater London Office Market. The Journal of Real Estate Finance and Economics, 15, 77-92.

